
There will come a point during your project where the users will start to ask about getting information back out of this new, slick Mendix application that they are all putting data into. As a BI professional, I’m not talking about OLAP models and prediction modeling. OLTP (On-Line Transactional Processing) applications like the ones you build with Mendix are all about data capture and workflow transformation. But every mature application offers its users some ability to report on the information within it. I’m going to describe one method I use for building these reports in this post, so if that interests you read on!
When I first approached building a report, I found what I thought was my natural habitat by trying to use the “Report Pane” and Data Set objects built off of OQL (Open SQL). I’ve been writing SQL for so long that it simply is the most natural way for me to get information. However, I quickly found I had a few issues and learning curves to overcome.
The first issue was learning how to write OQL against two-column database models like Mendix uses. Primary and Foreign key relationships are implicit through the join table rather than explicit. There was no need to use the ‘ON’ statement within the ‘FROM’ statement when specifying a join. If you know SQL then you know what I’m referring to. Otherwise, understand that the lack of specificity needed was both freeing and limiting. I don’t have to think about the criteria to join: It just happens. But what happens when you have two or more associations between two entities because of different relationships in the data? I ran into that issue recently and while I’m sure there is a way to create the join specifying the association I want, I’ve also developed a keen sense of “Best Use Of Nolan’s Time”…exploring this and all of the facets of OQL and two-column models just doesn’t rank high enough in that paradigm.
The second issue I faced getting the report parameters to play nice with my data set. In particular was the use of datetime parameter ranges. I eventually got one to sort of work, but the effort was quickly becoming too great for writing simple reports. I was really missing my robust reporting tools like BusinessObjects and Cognos!
I scrapped that pursuit and decided to build my own way of doing things.
The first thing I did is create a new Module in my application titled ‘Reports’. I wanted a clear delineation and a separate model focused on all things reporting. If in the future I wish to build a data model such as a star-schema optimized for reporting, I want it to be separate from my normalized application Module. I’m not entirely sure how Mendix treats the separate Modules in the backend engine but I like to believe they separate them by logical or physical partitions and such. In any case, it keeps it nicely separated and organized in the Modeler.
Next I needed to build a way to capture and use parameters (prompts). Because these are for runtime reports I didn’t need to persist the choices as they will be different each time someone runs the reports. The nice thing about building your own is that you can keep adding attributes for each report that you create requiring different criteria while leveraging attributes that already exist, such as a StartDate and EndDate. You’ll notice I also created an Enumeration for ‘FileType’. The user gets presented with the output versions I have built. More on that later.

Then I decided on how I was going to use this. I created a page in my “Administration” view (since for now these are the only ones requesting reports) with a Navigation List (Advantage is I can reuse this as a snippet on my mobile pages).
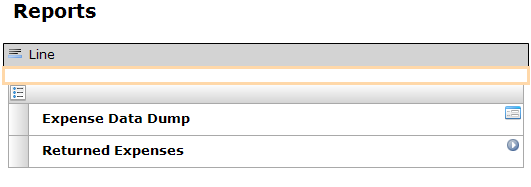
Once a list item is pressed, such as the ‘Returned Expenses’ we are using for this example, a microflow is kicked off that creates a “ReportParameter” object and then a ‘Show Page’ action that shows a popup page containing the report parameters for this report.
At present, this page is only being used by this one example report, but as the number of reports grow, the page will utilize “templates” to show the parameters based on which report was selected so the right ones get shown (another topic for another day).
Once the user fills in the parameters and “Submit’s”, the following Microflow kicks off (Apologies I’m not using the new viewer Mendix has made available to us bloggers to make this easier but the project this example is pulled from is still using version 5.12 of the modeler so I can’t leverage that new feature):
This might be a bit difficult to read so let me walk you through what is happening. First I need to return the Department of the current user so that I only pull back ExpenseWorkflow objects that are from that same Department.
Next, I have an Exclusive Split to determine which ‘FileType’ they chose. For now I’m only offering PDF or Excel. Let’s follow the PDF option first.
In order to understand the Microflow, we need to first look at the DocumentTemplate built to support what is happening.
I like to design the template first and then figure out how to build the logic to populate it afterwards. In this template (Company logo has been erased for this example), I’m going to group the returned Expenses by whom they were returned to during the parameter chosen Start and End dates. The ‘Account’ on the grid is a Template Grid. I use these most often for PDF and stylized reports so I can embed tables and get precisely what I want on the page and where. This table layout is similar to how we built reports in tools like Cognos and Crystal Reports.
In order to show the ExpenseWorkflow details within the account, I added another Template Grid and through the association of “ReturnedExpenses_SentTo/ReturnedExpenses” I was able to join to the related ExpenseWorkflow objects to be shown. ‘ReturnedExpenses’ is a non-persistent entity I created in the Report Module that stores the relationship between the “SentTo” account (Returnee) and the ExpenseWorkflow for each WorkflowObject. Since this is just for the report I didn’t want to muddy my application domain model with extra associations and keep all of this in the Report Module.

This setup required that I do so work in my microflow so that I only grouped Account’s that were sent a returned ExpenseWorkflow object. “Wait, isn’t that relationship the opposite of what I am showing in the template, where ExpenseWorkflow drives the Account not the other way around?” Yes. Yes it is. Hence the microflow work. Let’s go back to that.
If you recall, before I split the flow based on ‘FileType’, I had already retrieved a list of ExpenseWorkflow objects within the selected data range that the user chose. But I’m not passing that list into this PDF template because it requires an Account list based on how I developed it. Somehow I had to send the account list of only the unique accounts that had an ExpenseWorfklow object returned to them and then associate those unique accounts back to the retrieved ExpenseWorkflow list for the chosen Report Parameters. Hey, I didn’t say this was easy I just said it made more sense to me than the Report Pane and Data Set in Mendix! Here’s how that works:
As you can see, I iterate through the ExpenseWorkflow list to grab only unique Accounts. Remember that one account could have multiple returns during a Parameter-chosen time period. Then before moving on through the loop I create a ‘ReturnedExpenses’ object that sets the association to the Account to be the $Account retrieved and the association to the ExpenseWorkflow to be the $IteratorExpenseWorkflow object. What this does is give me the association needed for my template grid to populate the ExpenseWorkflow attributes related to the Accounts for that given time period that meet the “Returned” criteria. That’s a mouthful.
I sort the Account list and finally build and export the report. Don’t forget to name your report in the “Create FileDocument” step!
Voila, here’s an example of the output (I again erased any client-related information):
The report is instantaneous, and because I opted to display the report in the browser if available the user is able to view this in a separately generated browser tab without impacting them in the application. Finally it closes the Parameter page and the process is finished.
The Excel version is similar but it is really just a data dump. I could create ‘ReturnedExpenses’ objects that set the associations like I did in the PDF branch, open a page with a data grid that retrieves it and then an “Export to Excel” button, but I’d have to persist the data then wipe it and I'd rather give them similar functionality where it just retrieves and returns the data in that format for them. Problem is there is not “Excel” format specifically for the “Generate…” action for document templates.
In order to achieve this goal, I created a simple document template that lists the data as rows (no groupings like the PDF format). Here’s what that looks like:
The trick to making this work is two-factored. First, when generating the report, choose ‘HTML’ as the output format. Then change the FileDocument ‘Name’ you created (in the example it’s the “ReturnedExpensesReport_Excel”) to be ‘yourdocumentname.xls’. When it downloads in the browser (don’t select to open it in the browser as an option) your system will know what program to open it with assuming you have MS Excel or equivalent that knows how to open .xls files. Excel will likely throw a warning when opening it but just accept it as it’s from a trusted source and there you have your report. It might not look the best as images don’t come through but that’s not really what you’re after in this situation. You want the raw data in rows and that’s what you get.
I know this was a particularly long post (trust me, I had to write and edit it!) I hope those of you that made it this far will have either learned some useful tips or will add some comments about different ways you have solved the need for application information!