A month or two ago I wrote about using Document Templates for reporting. At that time I was pressed for time and needed to get a few reports in PDF form out the door. I even commented that I had tried to use the Report Pane and OQL built into Mendix but struggled with the process and didn’t really have time to dive into figuring it out. This past week, however, I couldn’t build the reports I needed to do using Data Grids or Document Templates. I went back to OQL feeling confident I could write the syntax to achieve what was needed and after a day and a half of trial and error, I figured it out. I’d like to share what I learned.
The Report Requirement
I needed to build one of the most basic reports imagined: Aggregate Counts. In this particular scenario, I needed to ask the user how they wanted transactions to be grouped and counted, such as ‘by Role’, ‘by Status’, etc. I had roughly seven different aggregations that needed to be achieved based on a user’s selection. Additionally, since the primary data is separated logically by a Department entity that is also linked to a User, I needed to ensure that the report runner only queried data within their own department. Simple stuff for a BI guy, right? Well, I found out not exactly.
Trial 1
Given that the business owners in this application prefer to be able to navigate from one list to another based on their choices (we call that ‘Drill-Thru’ in BI), I figured the easiest approach to accomplish this would be with Data Grids, setting up a default button that took the context of what they selected and navigated them to another related report they determined. I had already developed a ReportParameter non-persistent entity for my Document Template reports that stores the user’s prompt selections so that I can pass those in to my queries and get the data needed to populate the Document Template. I created a similar workflow where the user would be first prompted with a pop-up to select the grouping which was based on an Enumeration, and a created Date Range that then navigated to a page with a DataView passing the ReportParameter object into the caller of the page and then nested a DataGrid against the data I was attempting to group and aggregate, i.e. my ‘Expense’ entity. I needed to create an association from Expense to ReportParameter because many Expenses could be associated to one ReportParameter.
Problem 1
You can’t originate an association to a non-persistent entity, only from. I get it, but it didn’t help solve the problem because as a report writer, that was the association I needed to create. It meant I would have to persist ReportParameter, which I really didn’t want to do because that means I’m writing data to the database that I don’t really care about or need (I don’t care when someone runs a report, etc.).
Trial 2
The association model wasn’t going to work. How about doing it all through a Microflow then? I tried this next. I created a Microflow for the Data Grid that took in the grouping from ReportParameter (the DataView object encapsulating the DataGrid), built an ExclusiveSplit and returned the Expenses for the given Date Range and passed them in as the list for the DataGrid. This meant I was going to have to build seven datagrids returning each result set and nesting each in a table within the dataview so I could show/hide the row with the correct Grouping selection, but so be it. I’ve used this technique many times when I need to be explicit. I can pull that ‘Department’ for the CurrentUser and only get back Expenses associated accordingly in the Microflow. This was going to be great.
Problem 2
I knew the DataGrid had the ability to aggregate but I hadn’t used it before. I figured it would work like this: Drop in the attributes and the measures (the fields you want to aggregate) and it would group and aggregate according to what was in the display of the DataGrid. I was wrong. Aggregate simply means that at the end of that particular DataGrid it will aggregate a total for you. It will not group data. (FWIW, I plan to submit this as a feature request as I could see that being very helpful). So this method wasn’t going to work.
Trial 3
Sticking with Trial 2, I decided I would pre-group the data and split it according to Department.
Problem 3
That’s a static solution and I needed it to be dynamic. I don’t want to update my microflows and create DataGrids everytime the application administrator added a new Department. Nope to this idea.
Trial 4
Document Templates
Problem 4
Same as Problem 3. It would require static solution and further development each time a new Department was added/modified/deleted.
Solution
Finally, I realized the only way I was going to get this to work (for me) was to write the OQL. I had never really written OQL, but I’ve written SQL for 10 years so I felt pretty comfortable I could get the hang of the differences. After figuring out how to use associations instead of explicit join “ON” statements, I was starting to make progress. But then I ran into a problem. I needed to write a stitch query to accomplish my result set. But first I couldn’t figure out how I was going to use Session Variables to determine the Department dynamically. I’ll save you from the headaches and research I did, but on a whim I started typing WHERE Account.ID = and then hit the control+space and up popped the ‘[%CurrentUser%]’ token. Until I tried to compare it to the Account ID I couldn’t see that the token was available in OQL, but I figured it must be when I saw other tokens appear in other attempts on the Date, for example. Anyway, this was a key breakthrough.
Now to write the query. I attempted something like the following:
SELECT t2.STATUS as STATUS, sum(t2.COUNTER) as TOTAL
FROM (SELECT D1.NAME as NAME FROM table Account as A join A/path/Department as D1
WHERE A.ID = ‘[%CurrentUser%]’) as T1
JOIN (SELECT E.STATUS as STATUS, D2.NAME as NAME, 1 as COUNTER
 FROM table Expense as E join E/path/Department as D2
 WHERE E.CreatedDate in ?pDateRange) as T2
ON T1.NAME = T2.NAME
GROUP BY T2.STATUS
ORDER BY TOTAL
Simple stitch query. This is pseudo code, of course, buy you get the gist. No errors, so I run and navigate to the report. I attempt to run it and get an error in the console. Let me stop here for a second. I found this process frustrating. You get some feedback in the DataSet where you are building the query, but you don’t know if it will work until you try to run it in the front end. There is no ‘test’ in the DataSet. I’ll be adding that as a feature request as well. In addition, the code should have worked and the message I got in the console was simply that it wouldn’t.
I then removed the “ON” statement and recreated it in a WHERE statement. It didn’t work either. It did not like stitching it together in this manner. I then tried another way so that I wasn’t nesting multiple queries and better optimizing the code to something like this:
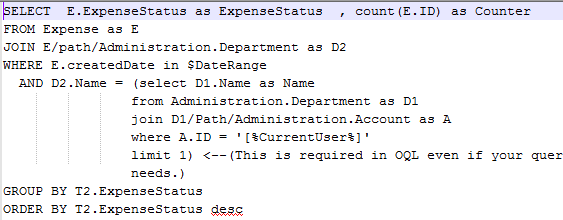
SELECTE.ExpenseStatus as ExpenseStatus, count(E.ID) as Counter
FROM Expense as E
JOIN E/path/Administration.Department as D2
WHERE E.createdDate in $DateRange
AND D2.Name = (select D1.Name as Name from Administration.Department as D1 join D1/Path/Administration.Account as A where A.ID = '[%CurrentUser%]' limit 1) <--(This is required in OQL even if your query would only result in one result. You could use TOP or a few others depending on your needs.)
GROUP BY T2.ExpenseStatus
ORDER BY T2.ExpenseStatus desc
Finally, it worked! This, too, is pseudo code but it should be close enough to give you the idea.
I was able to quickly generate the seven data-sets and the report pages for each grouping type. Ideally, I wanted to pass in my Enumeration as a parameter so I could use just one DataSet. I thought that if I made the Name of the enumeration match the attribute name I could use it as such so the GROUP BY and SELECT statements could be modified accordingly but no such luck. I’ll submit this one but we’ll see.
Finally, I wanted to build some drill-down and drill-through’s. I found the ‘ZOOM’ setup in the report pane but was disappointed. It only allows you to pass result set attributes to parameters in the next report. That is partially helpful and necessary, but there is no way to pass the parameter values of the parent report into the zoomed child report. The $DateRange, therefore, can not be passed which is a deal breaker on drill-down for me for now. I also can’t map attributes from a DataView into parameter values of a DataSet within the report pane.
So there it is. I wanted to share the failures along with the successes to help understand how I approached it and learn from the failures I encountered. I know this one was pretty long and definitely deep, especially if you aren’t accustomed to SQL or OQL, but I hope it helps some of you out there looking to write reports.